





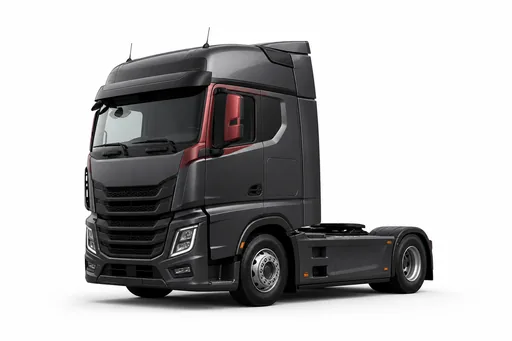
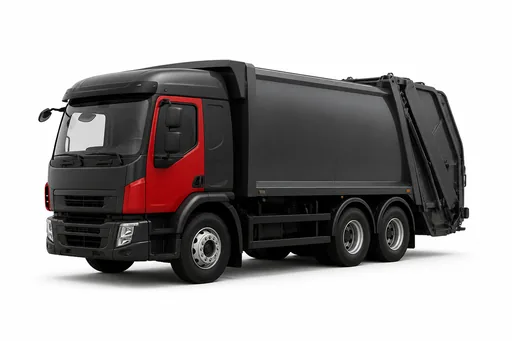
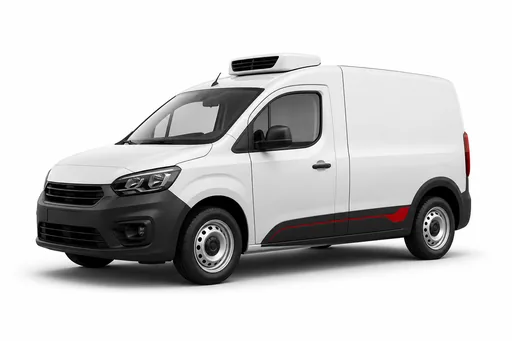
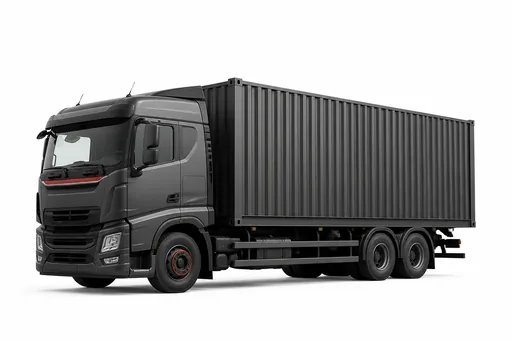
Last mile delivery is the final leg of a shipment, from a local hub or store to the customer's door. It is the most expensive and the most visible part of the journey, and in India it is growing faster than almost any other part of logistics, driven by online shopping, quick commerce, and demand from smaller cities.
This page brings together the latest last mile delivery statistics for India, with global benchmarks, festive season data, and what the numbers mean for businesses that run delivery fleets. Every figure names its source.
Key last mile delivery statistics at a glance
- India's e-retail market reached $65–66 billion in GMV in 2025, and is projected to reach $170–180 billion by 2030 (Bain & Company).
- India now has 290–300 million online shoppers (Bain & Company).
- Quick commerce reached $10–11 billion in GMV in 2025, after doubling every year since 2023 (Bain & Company).
- India's express parcel volume was expected to reach 10–11 billion shipments in FY25, and 29 billion by FY30 (IBEF).
- India's last mile delivery market is valued at $7.51 billion in 2025 and forecast to reach $14.45 billion by 2031 (Mordor Intelligence).
- The last mile accounts for 41% of total supply chain costs (Capgemini Research Institute).
- Fuel makes up 42.1% of road freight costs in India (NCAER study for DPIIT).
- What is last mile delivery?
- India e-commerce and parcel statistics
- Last mile growth forecasts
- Quick commerce statistics
- Festive season delivery statistics
- Last mile delivery cost statistics
- Customer expectation statistics
- What the numbers mean for delivery fleets
- FAQs
What Is Last Mile Delivery?
Last mile delivery is the movement of goods from the final hub, warehouse, dark store, or retail outlet to the end customer. In India it is usually done by two-wheelers, three-wheelers, and small vans, often across dense city traffic, narrow lanes, and addresses that are hard to find.
It matters because it is the step the customer actually sees. A late, missed, or damaged delivery is what a customer remembers, whatever happened earlier in the supply chain.
India E-Commerce and Parcel Statistics
The size of India's online market sets the volume that last mile fleets have to carry:
- E-retail GMV: $65–66 billion in 2025, growing at 19–21% a year (Bain & Company, How India Shops Online 2026).
- Online shoppers: 290–300 million, roughly double the number five years earlier (Bain & Company).
- Smaller cities: tier 2 and smaller cities contributed about half of the additional e-retail orders in 2025 (Bain & Company). That means longer routes, more scattered drops, and harder-to-find addresses.
- Parcel volumes: India's express parcel volume was expected to reach 10–11 billion shipments by the end of FY25, with e-commerce making up more than half of it (IBEF, 2025).
- Fulfilment network: India's micro-fulfilment network has grown to more than 7,000 centres (Bain & Company).
Last Mile Delivery Growth Forecasts
- E-retail: projected to reach $170–180 billion in GMV by 2030, about 2.7 times its 2025 size (Bain & Company).
- Quick commerce: projected to reach $65–70 billion in GMV by 2030 (Bain & Company).
- Express parcels: projected to reach 29 billion shipments by FY30 (IBEF).
- Last mile delivery market: $7.51 billion in 2025, forecast to reach $14.45 billion by 2031, a compound annual growth rate of 12.67%. B2C deliveries make up about 70% of the market, and e-commerce retail about 54% (Mordor Intelligence).
Market-size estimates vary between research firms because each defines the "last mile" differently, so compare forecasts from the same source over time rather than across sources.
Quick Commerce Statistics
Quick commerce, delivery in under 30 minutes from nearby dark stores, has changed what Indian customers expect from every delivery:
- Size: $10–11 billion in GMV in 2025 (Bain & Company).
- Growth: GMV has doubled every year since 2023 (Bain & Company).
- Shopping time: a quick commerce shopping session takes under five minutes, compared with more than ten minutes in traditional e-retail (Bain & Company).
For delivery fleets, quick commerce means short, frequent trips, very tight time windows, and riders who need to know exactly where they are going. Live tracking and accurate arrival times are no longer extras; customers expect to see them for every order.
Festive Season Delivery Statistics
The festive season, from Navratri to Diwali, is the biggest test of the year for last mile fleets:
- 2026 opening: e-commerce platforms sold goods worth about ₹24,200 crore in the first two days of the 2026 festive sales, across an estimated 8–9 crore orders, nearly six times the normal daily level (Redseer, October 2026).
- Sales growth: online retail GMV grew 23–25% year on year in the first two days of the 2025 festive sales (Redseer, September 2025).
- Order surge: daily order volumes in the final festive weeks of 2025 were 300–400% above normal levels, across brands on the EasyEcom platform (EasyEcom Diwali 2025 report).
- Peak hours: 45% of daily festive orders were placed between 9 AM and 1 PM (EasyEcom).
- A longer peak: the peak is no longer a single week; order volumes stayed high for several weeks, and dropped sharply on Diwali day itself (EasyEcom).
These numbers explain why the festive peak is so hard on delivery fleets: several weeks of order volumes far above normal, concentrated in a few hours of the day, with more orders going to smaller cities on longer routes. For the full list of festive delivery challenges and a step-by-step plan to handle them, read our guide "8 Festive Season Delivery Challenges and How to Solve Them" in the Anstel Knowledge Center.
Last Mile Delivery Cost Statistics
- Share of supply chain cost: the last mile accounts for 41% of overall supply chain costs, according to a global study by the Capgemini Research Institute.
- Logistics cost in India: logistics cost 7.97% of India's GDP, or ₹24.01 lakh crore, in 2023-24 (NCAER study for DPIIT).
- Fuel: fuel made up 42.1% of road freight costs in India (NCAER study for DPIIT).
The last mile is expensive because each drop carries a small load, routes have many stops, vehicles spend a lot of time idling in traffic, and failed deliveries mean a second trip. In India, cash-on-delivery orders that are refused at the door and sent back, known as return to origin (RTO), add a further cost on top.
Customer Expectation Statistics
- Good delivery pays: 74% of customers who are satisfied with delivery intend to increase their spending with that retailer, by as much as 12% (Capgemini Research Institute).
- Paid delivery memberships: 53% of customers would consider paying for a delivery membership (Capgemini Research Institute).
- Speed has become the norm: quick commerce has trained Indian shoppers to expect delivery in under 30 minutes for everyday items (Bain & Company), and that raises expectations for every other delivery too.
Accurate arrival times, live tracking links, and proof of delivery are now basic expectations.
What These Numbers Mean for Delivery Fleets
More orders, more cities, faster promises, and high fuel costs all point the same way: delivery fleets have to do more trips with the same vehicles, and know exactly where every vehicle is. A vehicle tracking system helps by:
- Showing every vehicle and rider on one live map, including hired vehicles during peaks.
- Giving customers accurate arrival times and proof of delivery.
- Cutting fuel waste from idling, detours, and speeding.
- Measuring time spent at each stop, so slow drop points can be fixed.
- Flagging breakdown risks early through engine fault codes and service reminders.
- Scoring driver behaviour, so that faster deliveries do not come at the cost of safety.
Anstel's Last Mile module and Connected Fleet, both part of the Autonautics platform, bring live tracking, route planning, alerts, and delivery records together in one dashboard, so delivery teams can plan for the peak and prove every drop.
Frequently Asked Questions
What is last mile delivery?
Last mile delivery is the final step of a shipment, when goods travel from a local hub, warehouse, dark store, or retail outlet to the customer's door. It is usually the most expensive and most time-sensitive part of the delivery process.
How big is the last mile delivery market in India?
Mordor Intelligence values India's last mile delivery market at $7.51 billion in 2025 and forecasts it to reach $14.45 billion by 2031, growing at about 12.67% a year. Estimates vary between research firms because they define the market differently.
What percentage of supply chain costs comes from the last mile?
A global study by the Capgemini Research Institute found that the last mile accounts for 41% of overall supply chain costs, making it the most expensive part of the journey.
How much do deliveries increase during the festive season in India?
Online retail sales grew 23–25% year on year in the first two days of the 2025 festive sales, according to Redseer, and daily order volumes in the final festive weeks were 300–400% above normal levels across brands on the EasyEcom platform.
How fast is quick commerce growing in India?
Quick commerce reached $10–11 billion in GMV in 2025 after doubling every year since 2023, and Bain & Company projects it to reach $65–70 billion by 2030.
How can businesses reduce last mile delivery costs?
Businesses can reduce last mile costs by planning routes from real trip data, cutting idling and detours, measuring time at each stop, reducing failed deliveries with accurate arrival times and customer updates, servicing vehicles before breakdowns, and using live tracking to get more trips out of every vehicle.
Turn Last Mile Data into Better Deliveries
India's last mile is growing fast, getting more demanding, and costing more than any other part of the journey. The businesses that win are the ones that can see every vehicle, every stop, and every delay as it happens.
Get in touch with the Anstel team to see how it would work for your delivery fleet.